The 120-year clean-electricity initiative, supported by the HM Government, rapidly gained popularity around 2017 before a thorough project evaluation due to the number of assumptions considering the strike price value necessary to enable the contract for a different framework between a PLC and HMG.
During my academic studies at Hertfordshire Business School, I analysed the risks and assumptions specific to the Swansea Bay Tidal Lagoon project, including establishing the strike price and evaluating the most optimal gearing ratio, cost of capital and net present value.
The following additional documents are offline. Please message me if you are interested in my analysis:
- Annex 1 – Power – Output Details
- Annex 2 – Power – Generating Costs
- Annex 3 – Power – Growth Rates
- Annex 4 – Power – Information
- Annex 5 – FX
- Annex 6 – Shares and Rights Issues
- Annex 7 – Cash flow In
- Annex 8 – Cost of Capital
- Annex 9 – Uncertainty
- Annex 10 – Financial stats
- Annex 11 – Ratios


Introduction
This report analyses the Swansea Bay Project on behalf of The Sustainable Generating Co PLC, set up as a joint venture with the UK Government using a contract for different frameworks to advise the company on the minimal strike price negotiated with the Government to make the project financially viable. Furthermore, assessments and models, including CoC, NPV and gearing ratios, will be interpreted and guide the source of financing whilst suggesting the most appropriate option. The report will also analyse TSGC’s current position, including recommendations based on identified risks and opportunities.
Swansea Bay project initiative
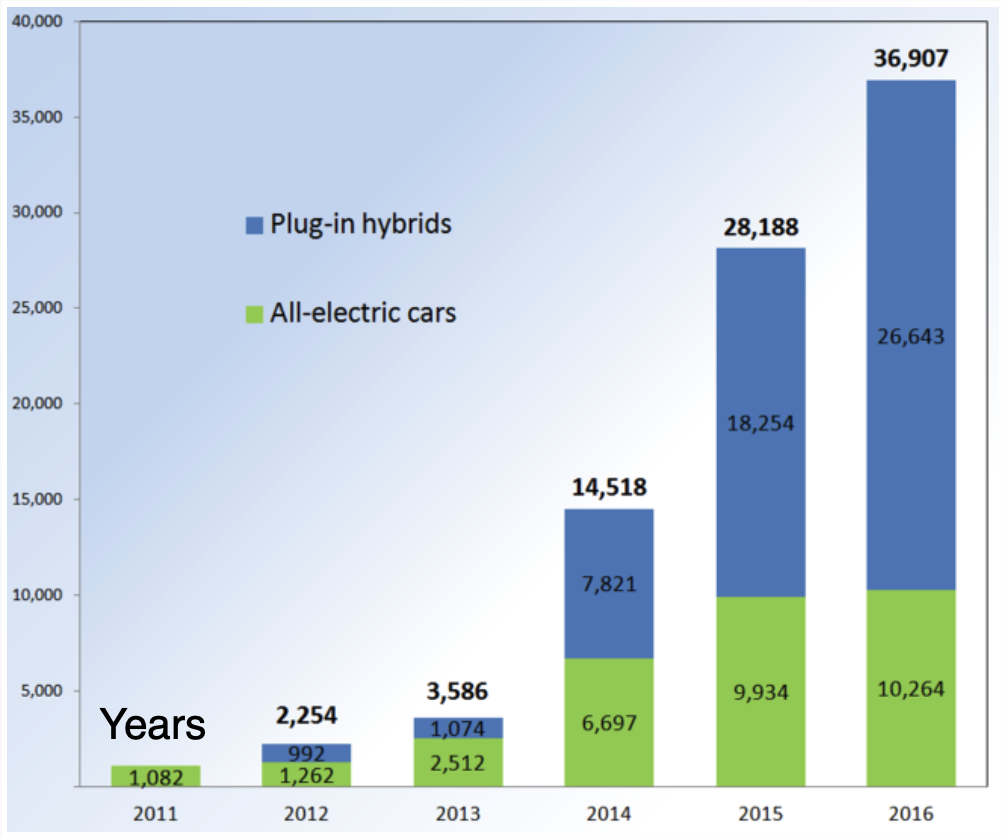
The Swansea Bay Project emphasises global warming and the impact of pollution and emissions on the generation of the greenhouse effect on the Earth’s atmosphere. The paper discusses various international agreements set up by the United Nations, such as the Kyoto Protocol and the Paris Agreement, designed to regulate and limit the emissions produced by motor vehicles and other industrial processes, such as having electric energy. The project goes beyond reducing emission levels, introducing the need to increase production capacity to satisfy the demand generated by electric or hybrid vehicles.
Whilst justifying the increased demand for electricity, the paper also refers to the HS2 Network Rail project and its estimated required capacity of 170MW/day.
Central Government
The paper compares different electricity sources, such as wind farms, diesel generators, and nuclear stations. It also mentions the UK Government’s efforts to encourage the development of cleaner energy systems. They are offering incentives and grants to motivate private companies to reduce pollution.
In one example, the UK Government partnered with Sustainable Generating Co PLC (“TSGC”) to create a tidal-based electricity generation system in Swansea Bay, Wales. This system will operate for 120 years under a “contract for difference” or CfD agreement. The UK Government and TSGC negotiated a price for the electricity generated by this system.
The purpose of the CfD agreement is to support eco-friendly investment projects. If the income from selling electricity falls below the agreed price, the UK Government will subsidise TSGC. On the other hand, if the income exceeds the agreed price, TSGC will pay the excess profit to the Government. These financial transactions will happen regularly, typically every six months, depending on the price difference.
Swansea Bay
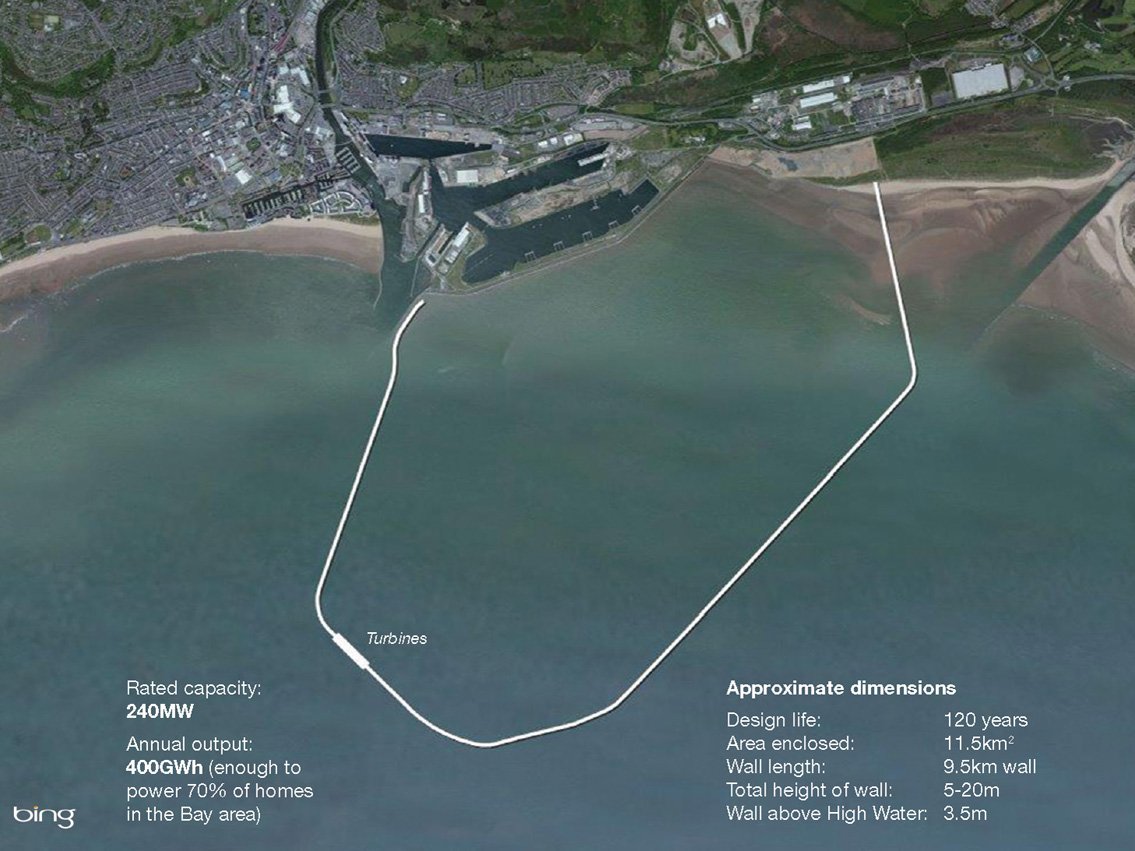
The project indicates Swansea Bay Tidal Lagoon as the ideal area due to its geographic shape and tidal potential in terms of tide range after enclosing the lagoon with a dam, as per the image below.
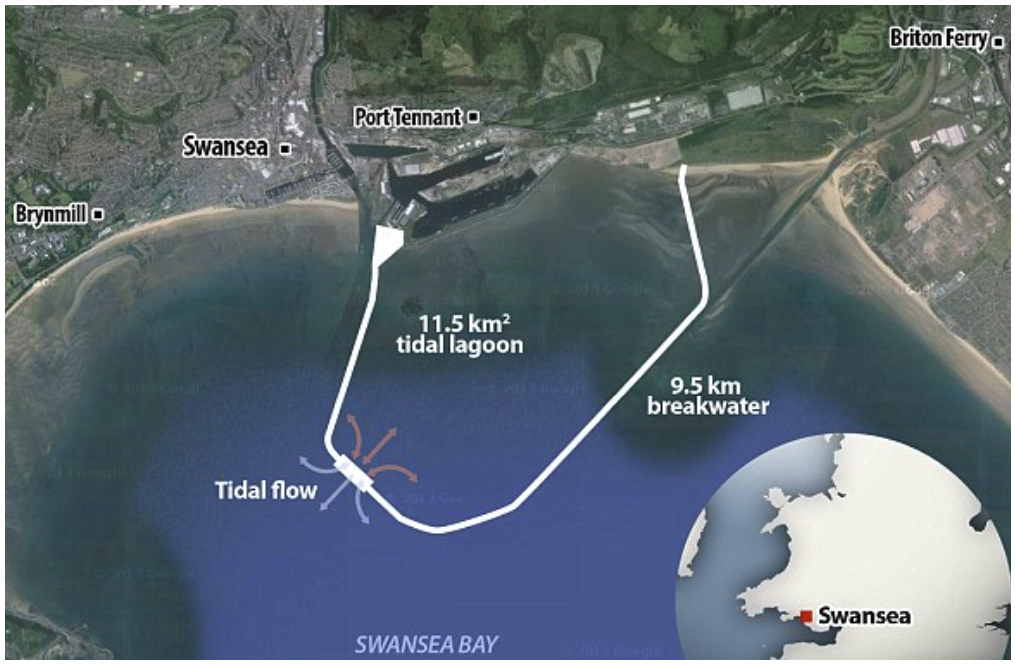
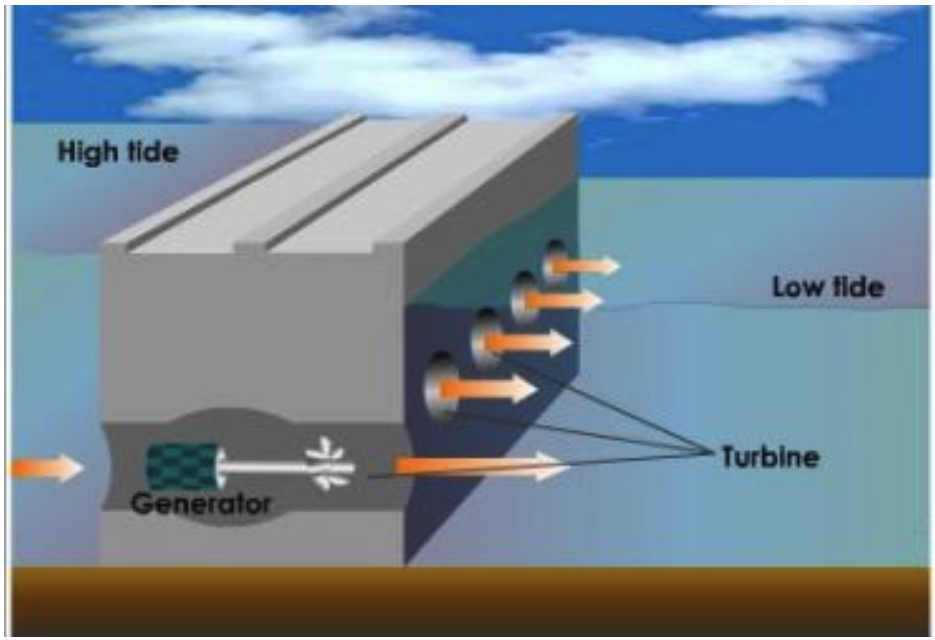
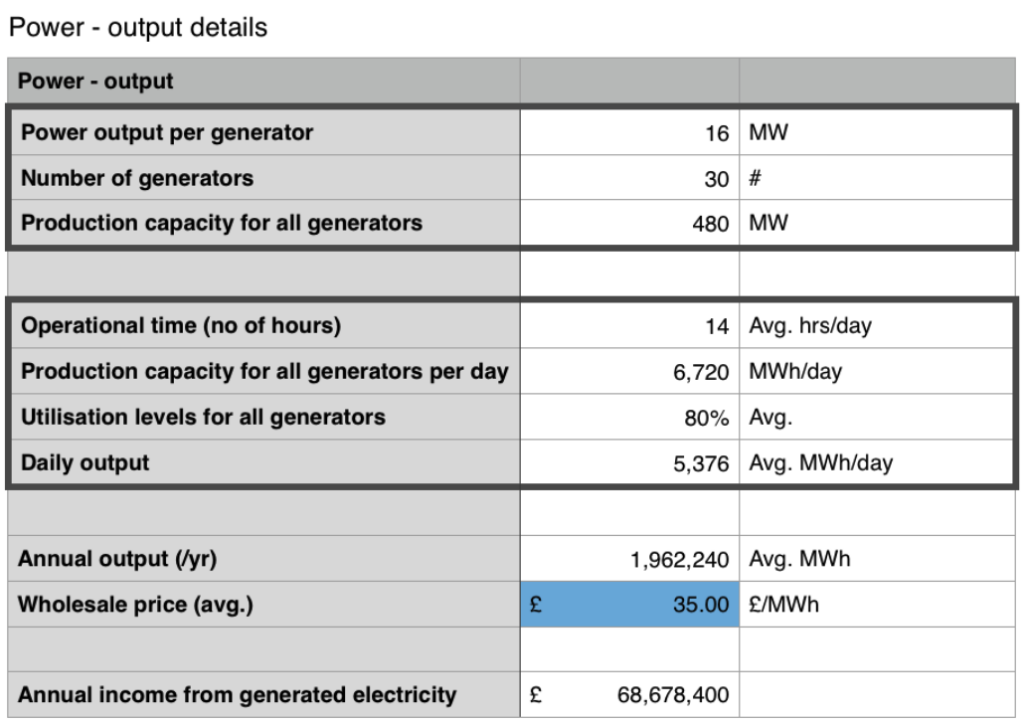
The principle behind the project involves closing the lagoon with a 22km long, 12m high dam. This leaves water to flow in or out whilst engaging 30 pitch blades cross-flow turbines into the flow of the water, with associated generators capable of producing 16MW output power per generator.
The purpose of the coursework
The coursework involves evaluating SBP for TSGC. We must recommend the minimum strike price for TSGC and the UK Government to ensure the project is financially viable. Also, we need to provide information on financing the project, including sources and recommendations.
Assumptions and risks
Now, let us talk about assumptions and risks. The paper details project specifics like costs, interest rates, materials, and technical production capacity. Below, we will discuss the assumptions and risks of the project.
Production capacity
Regarding production capacity, using the equipment listed in the project paper (Annex 1 – Intel – Power – output details), the system is expected to produce an average of 1,962,240 MWh per year. This should generate a wholesale income of £68,678,400 annually, starting in 2023. These income estimates are based on an initial wholesale price of £35 and an estimated yearly increase of 1.5% for 120 years.
Evaluation of the construction phase
The following project stages/cycles have been identified:
- Development and launch – 2017
- Launch – 2017
- Growth – 2022
- Maturity – 2023
- Decline – 2143 (2023 + 120)
The production capacity has been calculated based on the assumption that the project will start producing electricity in 2023 and that no delay will affect the construction stage (2017-2022), which is a risk for the project.
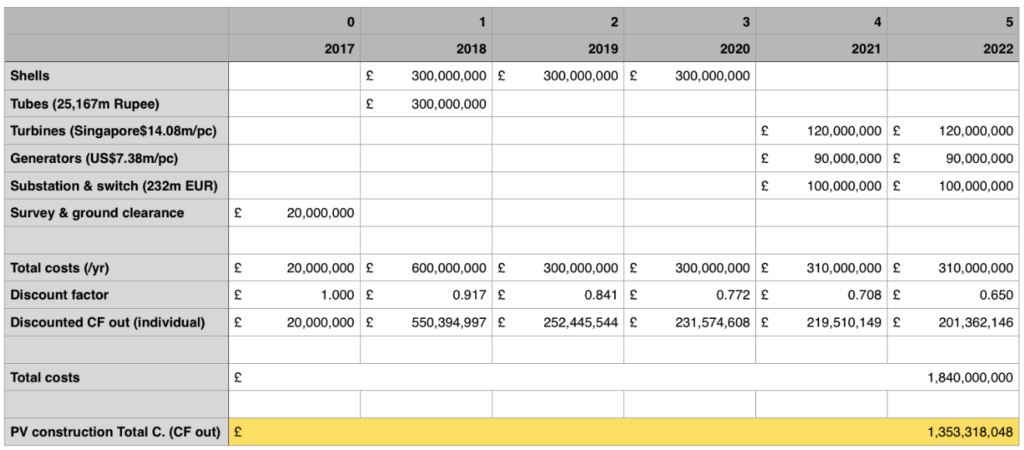
Most parts come from overseas, including India, Singapore, USA, and Germany. There may be delays in manufacturing and transport that could affect the launch date. If we use the discount factors, these delays will impact the timing and the expected cash flow.
Another assumption is about the system’s integrity. To generate the stated volume of MWh, all turbines and generators must operate at 80% capacity for 14 hours a day. Since there are no provisions for hardware failures, any defects will reduce the annual production capacity and permanently lower the forecasted wholesale income.
Evaluation of the wholesale price
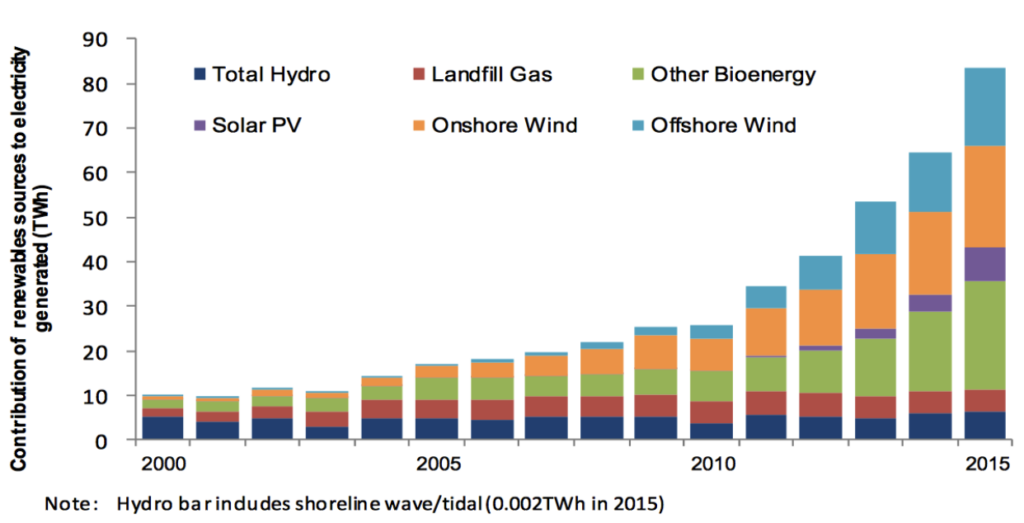
Now, let us evaluate the wholesale price. It starts at £35/MWh and increases by 1.5% annually throughout the 120-year project. Predicting commodity prices and relying on past values is unreliable because unforeseeable events and various PESTLE factors can disrupt cost and interest rate forecasts. This assumption needs to be revised due to the growing trend of alternative energy systems in the UK.
The sustainability of the initial £35 sale price and the estimated 1.5% yearly increase in wholesale prices are in doubt. This is because more businesses are adopting alternative energy systems each year, along with government grants promoting green energy.
Another assumption is the justification for the increased electricity demand – The High Speed 2 project. HS2 project has been restructured in two consecutive stages, decreasing to half the forecasted electric energy consumption.
Evaluation of production costs
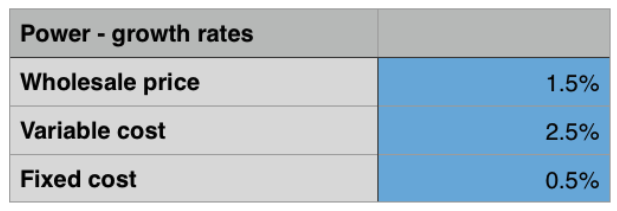
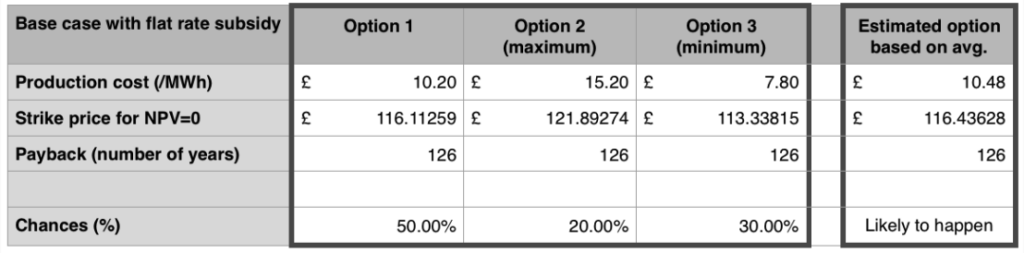
The project provides three alternative production costs, each formed from 70% fixed and 30% variable costs.
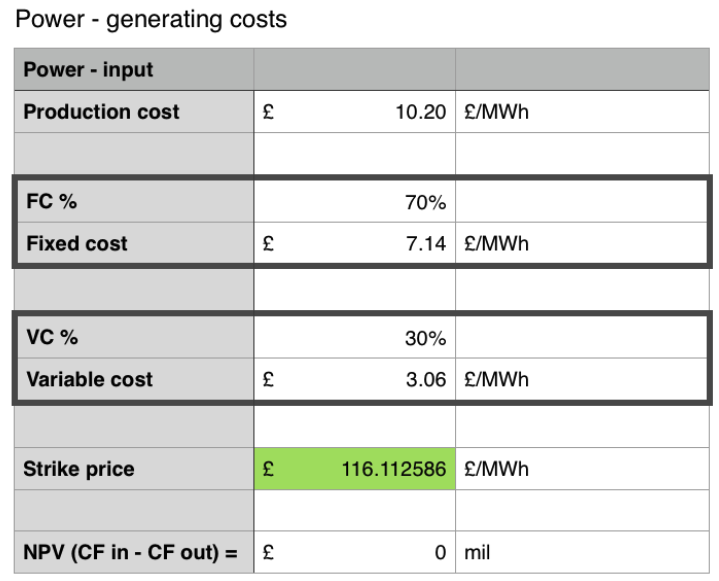
The paper introduces a yearly increase of 2.5% for the variable costs and 0.5% for the fixed costs. Those occur throughout the entire lifetime of the project – 120 years. However, it needs to list the factors which will increase these production costs, raising the question of the accuracy of the increase rates.
The paper also provides three potential alternative production costs to start in 2023. However, it does not describe the factors influencing each production cost.
Share price evaluation
The paper provides the current share price value listed at the London Stock Exchange listing to be £14.53. However, it cannot be foreseen that variations in the share price will occur in the future. The assignment requires the identification of sources of funding for the project investment. The share price will likely decrease if the initial investment is made available through issuing a surplus of simple shares.
Evaluation of the currency exchange and variations in the taxation system
Various parts required in the project’s construction are manufactured outside the UK. Those will be paid for and delivered in the next six years. This questions the relevancy of the currency exchange rates provided in the paper. In the context of Brexit, further trade taxes may also occur, disturbing the DCO forecast substantially.
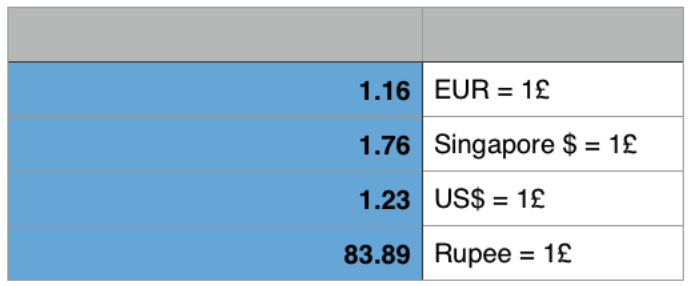
A solution is to fix the existing acquisition costs in GBP and schedule the delivery for the next six years. The above assumptions can severely disturb the cash flow by delaying certain milestones and increasing costs for parts.
Evaluation of the cost of capital
The CoC is needed to produce the PV. Therefore, it is a further value driver. The CoC can be calculated using the WACC method (Brealey et al., 2006) as follows:
VE/V*kE + VDJ/V*kDJ + VDS/V*kDS.
The main disadvantage of WACC is that it relies on historical data. Margins of up to 10%-15% should be applied to reduce the risks raised using historical data.
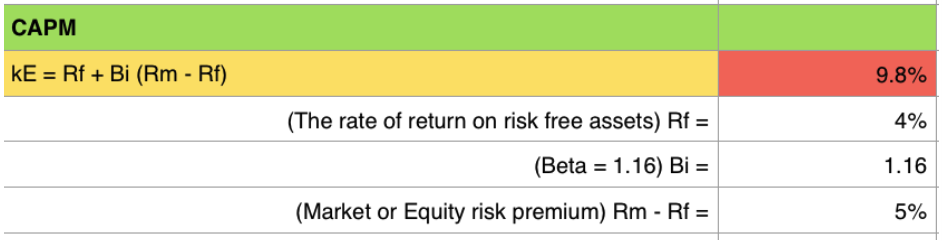
Evaluation of the cost of equity (KE)
The CAPM model assumes efficient markets (Pike & Neale, 2006) always exist. Mullins (1982) states that CAPM is a valuable tool for estimating expected returns, which is widely used and assumes that only systemic risk matters.
The DVM method cannot be utilised as the paper needs more information on dividend growth rate g.
Evaluation of the cost of debt (KD)
Junior debt evaluation
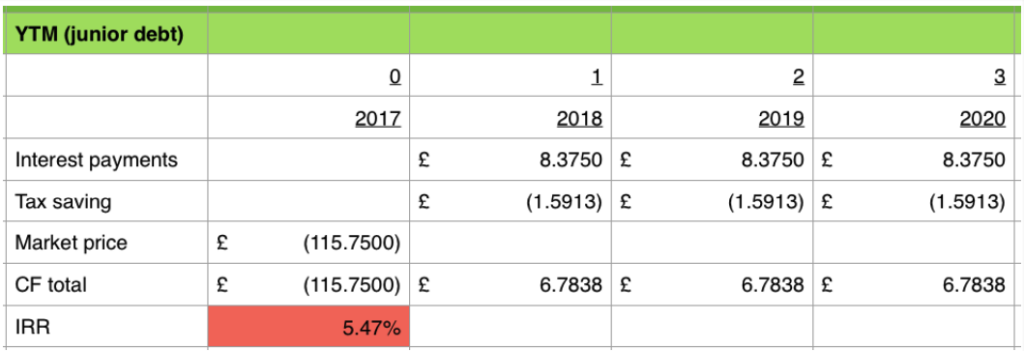
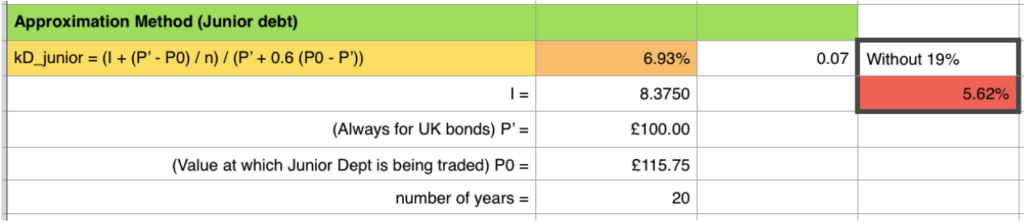
The cost of junior debt (KDJ) will utilise the result produced by the approximation method of 5.62% as it gives a more prudent estimation.
Senior debt evaluation
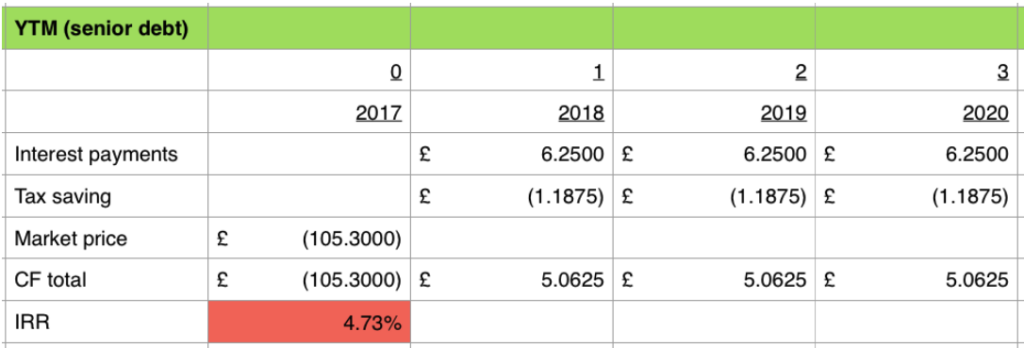
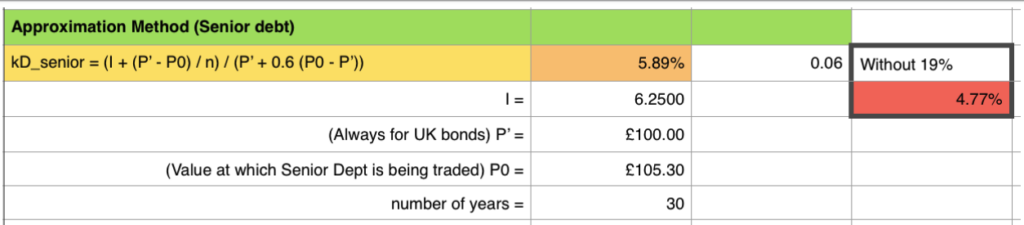
The cost of senior debt (KDS) will utilise the result produced by the approximation method of 4.77% as it gives a more prudent estimation.
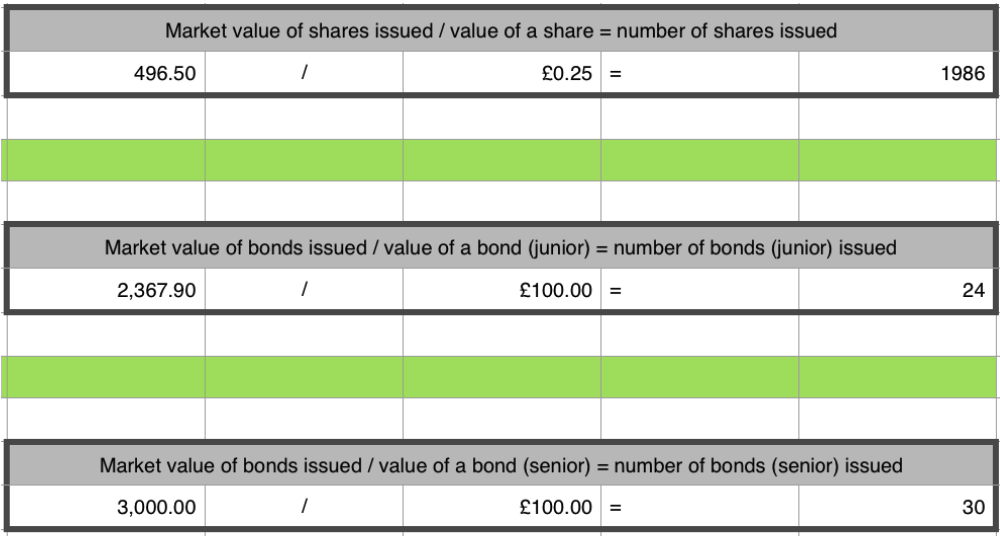
MARKET VALUES – VE, VDS, VDJ
Number of shares and bonds issued
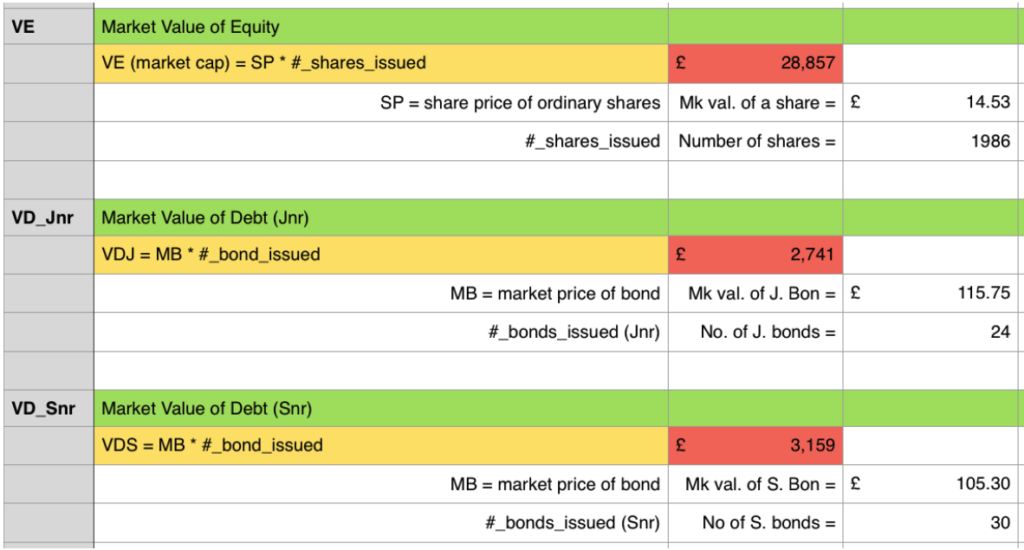
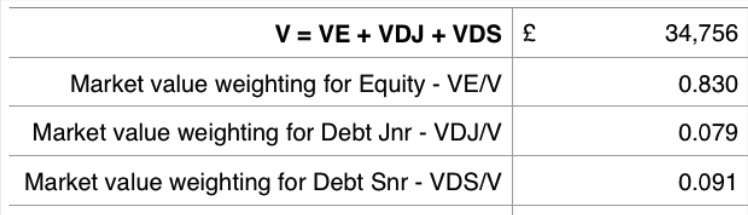
Evaluation of market value weightings
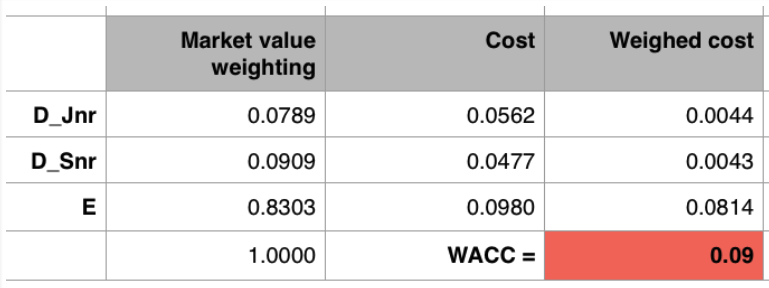
Evaluating WACC
The WACC factors are factored in using the following:
WACC = VE/V*kE + VDJ/V*kDJ + VDS/V*kDS.
Evaluation of cash flows
Cash conversion cycles are predictable and are triggered by the electricity production rate. This means that the forecasted cash flows will run constantly, without anomalies or fluctuations, unless hardware failure occurs. The main disadvantage of using cash flows is the inappropriate use of discounted rates using incorrect forecasting when an expense/income occurs. A false discount rate is applied by locking the cash flow into the wrong year.
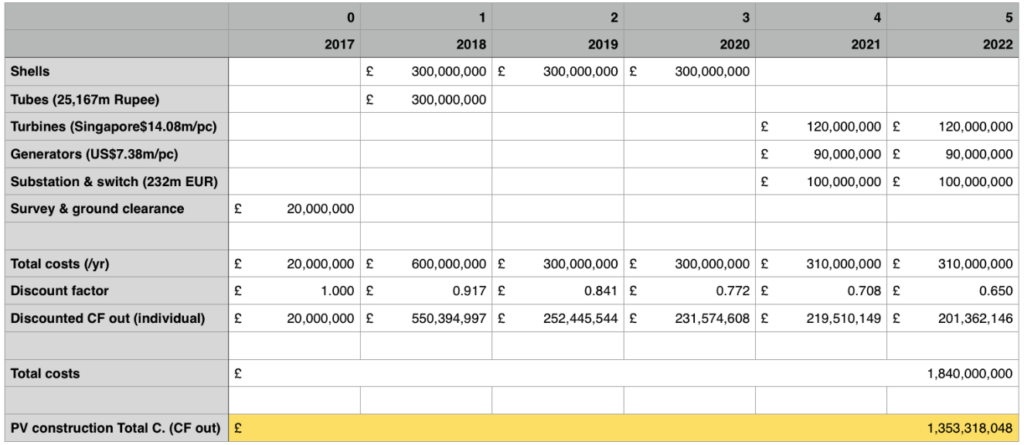
Evaluation of cash flow out
Having calculated the WACC using the NPV method, the report will compile all project setup expenditures of £1,840,000,000. NPV function accepts as parameters the WACC and the series reflecting the total costs allocated annually.
Evaluation of cash flow in
A similar exercise applied for the strike price income, variable and fixed costs, and wholesale income will produce the net cash flow.
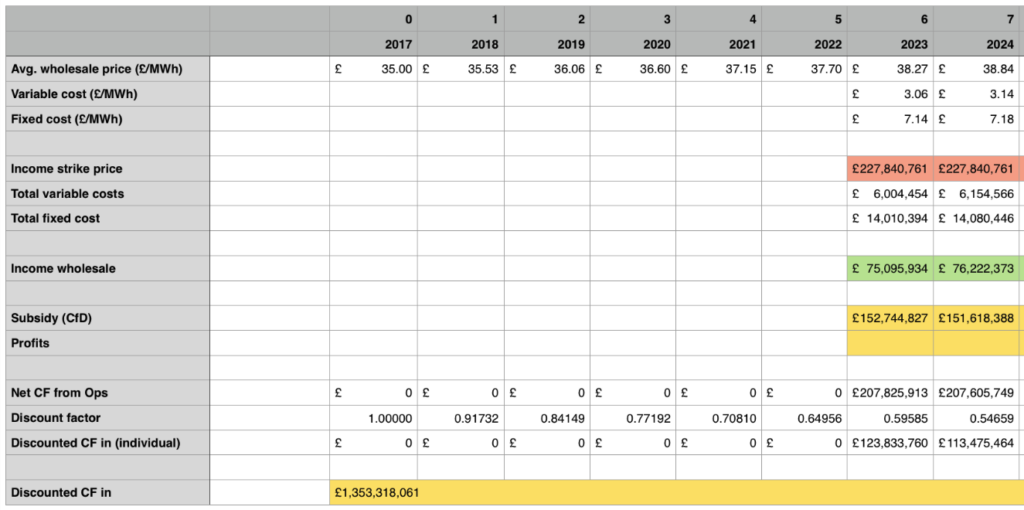
Income from the strike price is obtained by multiplying the strike price value with the annual output of 1,962,240MWh, whilst income from the wholesale price is calculated by multiplying the wholesale price by the annual output of 1,962,240MWh. The subsidy value is the difference between the wholesale income and the strike price income if the latter is higher, whilst the value of profits will be the difference between the strike price income and the wholesale income if the latter is higher.
An appropriate strike price value is obtained using trial and error. This symbolises that the report’s purpose has been achieved, and implicitly, a minimal strike price has been identified, which makes the project financially viable. The risk of incorrectly using the discount rate can lead to accelerated depreciation of cash flows or, contrary, a failure to depreciate transactions accordingly, substantially affecting the financial projections.
Payback evaluation
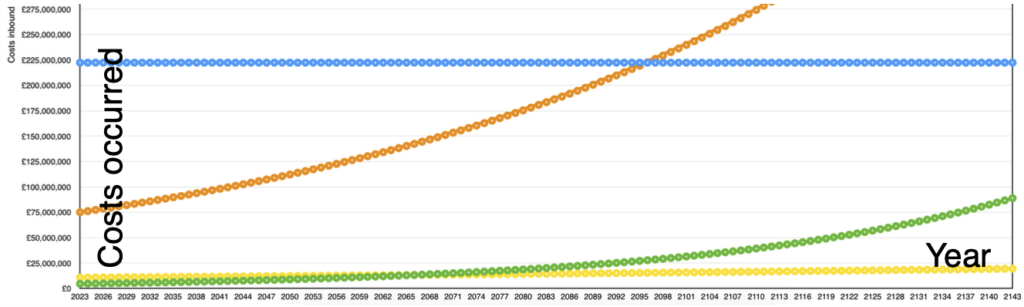
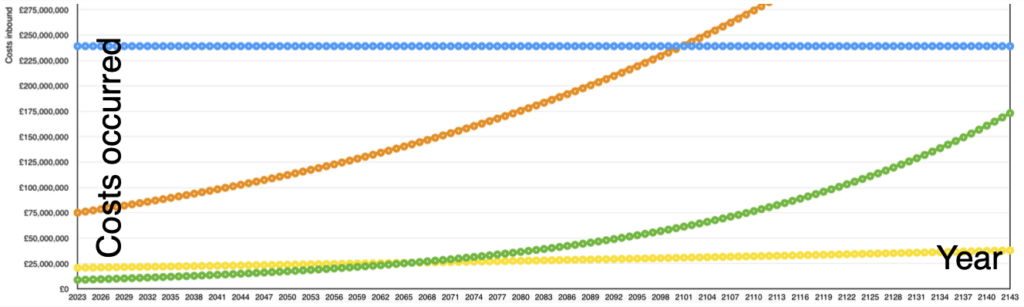
A further methodology can be utilised to assess where the payback occurs by compounding all discounted cash flow in/out early.
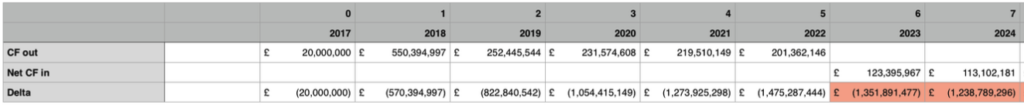
The ‘Delta’ value shows the compounded result, which decreases until 2022 and later increases as revenue begins to generate until it reaches a positive value. Despite being easy to use, the payback method’s limitation refers to the time value of money and cash flow after the pack period is left out.
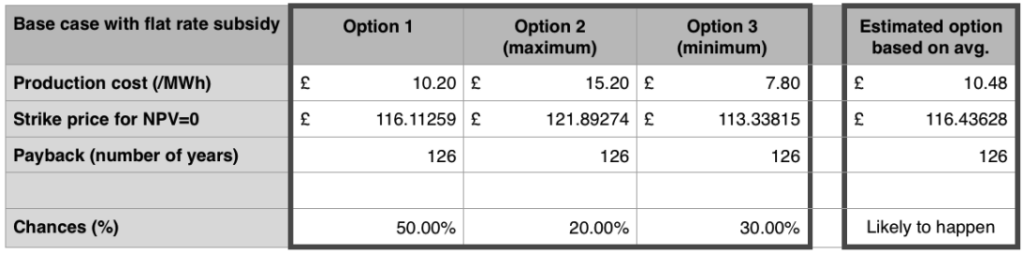
adjusted so that NPV is 0
For all three potential production costs proposed within the project, the payback is 126 years, starting from 2017.
NPV evaluation
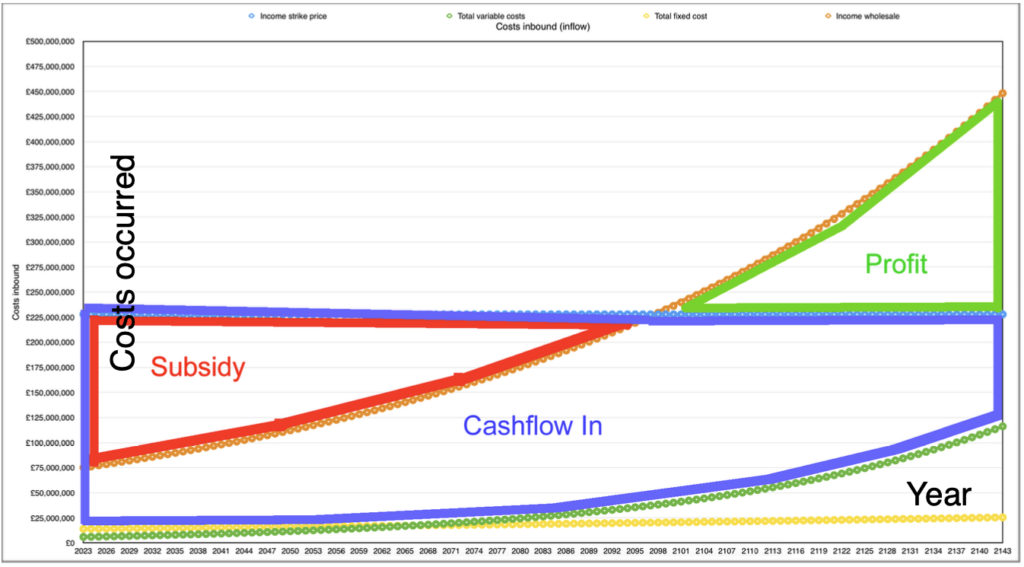
The NPV appraisal method (Arnold & Hatzopoulos, 2000) compares the discounted cash flow in and out to reflect the project’s profitability. Zimmerman (1997) and Kaplan & Atkinson (1998) claim that NPV is superior to other appraisal methods as it accounts for the time value of money and cash flow. Given that the report recommends a minimal NPV, which will make the project viable, the calculations described a scenario where discounted cash flow would equal discounted cash flow out.
Discounted cash flow out refers to the initial investment made by TSGC between 2017 and 2022 to order the parts and construct the infrastructure. Discounted cash flow refers to the cumulative value of the income from strike price minus fixed and variable costs, highlighted below as CI (“cash flow in”).
Analysis of TSGC’s current position
TSGC recorded a 5% increase in trade receivables from £4,300.6m in 2015 to £4,527m in 2016 and a substantial increase in cash of 70% from £458.9m in 2015 to £1,512.3m in 2016, suggesting a strengthened cash position. However, all current liability accounts recorded an increase of 14% from £7,518.4m in 2015 to £8,726.2m in 2016, raising questions about the potential of the business to access cash if required.
Shareholder equity
The value of the shareholder equity has increased by 16% from £5,119.5m in 2015 to £6,080.5m in 2016, with the most substantial increase of 33% under shareholder reserves from £2,183.3m in 2015 to £3,251.5m in 2016, suggesting the company may be preparing for a substantial change.
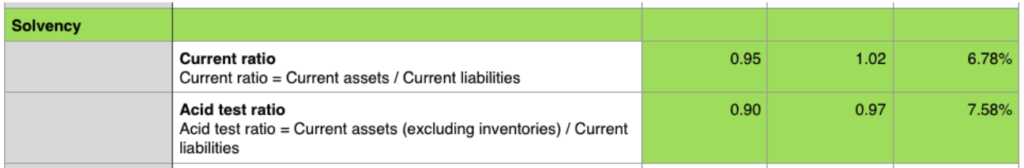
Overall, the company recorded increases in total fixed assets by 3% and total current assets of 20%, suggesting an increase in volume, which may prepare the business for an expansion. Current and acid test ratios have improved slightly from 0.95 to 1.02, respectively, from 0.90 to 0.97, suggesting that TSGC’s liquidity is unstable, putting the company in the least favourable position to access finance through debt.
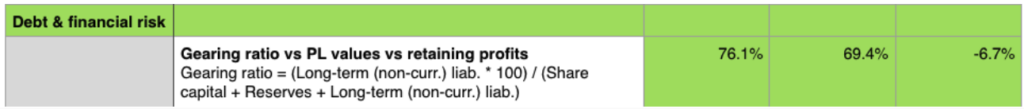
The gearing ratio amounted to 76.1% in 2015 and decreased to 69.4% in 2016, reducing 6.7%, suggesting that TSGC bears a high financial risk (Mullins, 1982). This means financing through debt is not a viable option for the business.
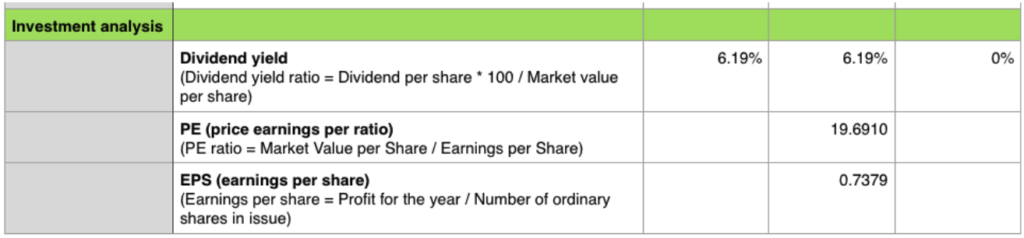
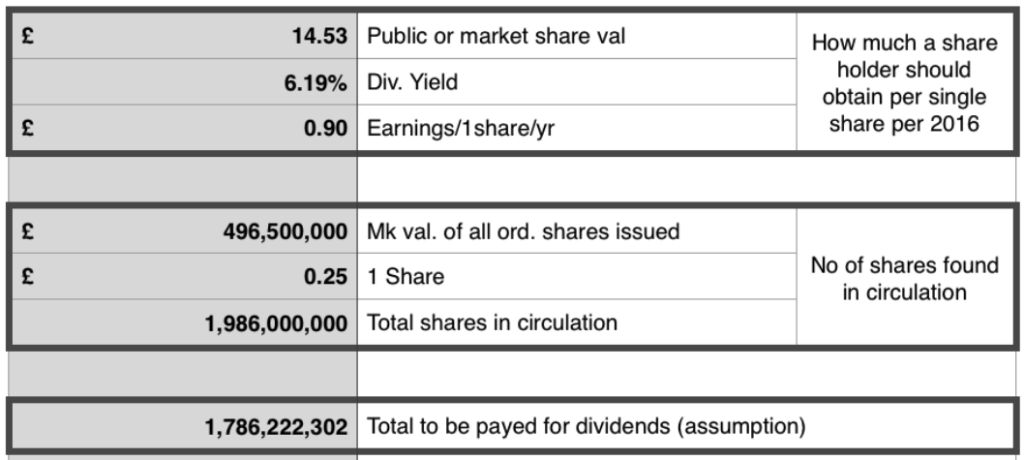
TSGC’s dividend yield amounts to 6.19%, and the PE ratio is 19.691, which the company’s size may generate. EPS values are recorded as £0.737.
Dividend evaluation and decision
When analysing the total value in dividends to be paid to shareholders, assuming a typical dividend policy, it can be noted that the business should pay £1,786m in dividends whilst the cash account records show only £1,512.3m available. Previous records from 2015 show a cash account balance of 70% lower of £459, raising questions about the ability of the business to release dividend payments to their shareholders as the dividend payment is currently unsafe (Pike & Neale, 2016) from the investor’s perspective.
Overall, TSGC’s investment position needs more certainty, challenging achieving access to further debt. The company’s overall shape is weak, with unstable access to liquidity, and not in an ideal condition to embark on a project with SB’s complexity and duration.
Financing and making an investment decision
The deal-breaker in this project refers to the failure to obtain the finance at the right time between 2017 and 2022. The success factor is securing the initial cca — £ 1.8bn investment. The KPIs refer to the measurement of supply and demand in the industry. The main ways to finance a business are to raise capital through debt by borrowing or equity through shareholders. Benefits of debt refer to the fact that interest on debt can be tax deductible, and the benefits brought by equity refer to the lower levels of risk introduced to the business.
Disadvantages of debt refer to the state of financial distress theory (Modigliani–Miller, 1958) in which companies can find themselves (Andrade & Kaplan, 1998). In contrast, the disadvantages of equity refer to the difficulty of raising capital relatively fast. Provided the high gearing ratio of 69% and the current ratio of 1.02%, the company is less likely to be allowed to access further debt to raise capital.
Lack of precedent
Although the business looks to be established, Swansea Bay as a project has no precedent, is not even in the early stages of development, and has yet to be secured. Therefore, banks will be reluctant to borrow money given the uncertain terms of acceptance risk, market share, market size, maintenance, and rate of decline. The second option is to increase the capital through equity by issuing rights issues. Rights issues are cheaper regarding costs, and no dilution of ownership and control of the rights offered are fully taken up.
Rights issues must be issued at a discounted rate between 15%-20% of the current market value of £14.53 and at a rate of 1:4 with already existing shares. This means that having 1,986,000,000 shares in circulation, the company cannot issue more than 496,500,000 new shares via rights issues. For locking the discount rate at 15% from £14.53, knowing that the business seeks to secure finance for the setup costs of £1,840,000,000 equivalent to the non-deducted cash outflow, the most optimal solution is for the company to release 148,981,823 rights issues.
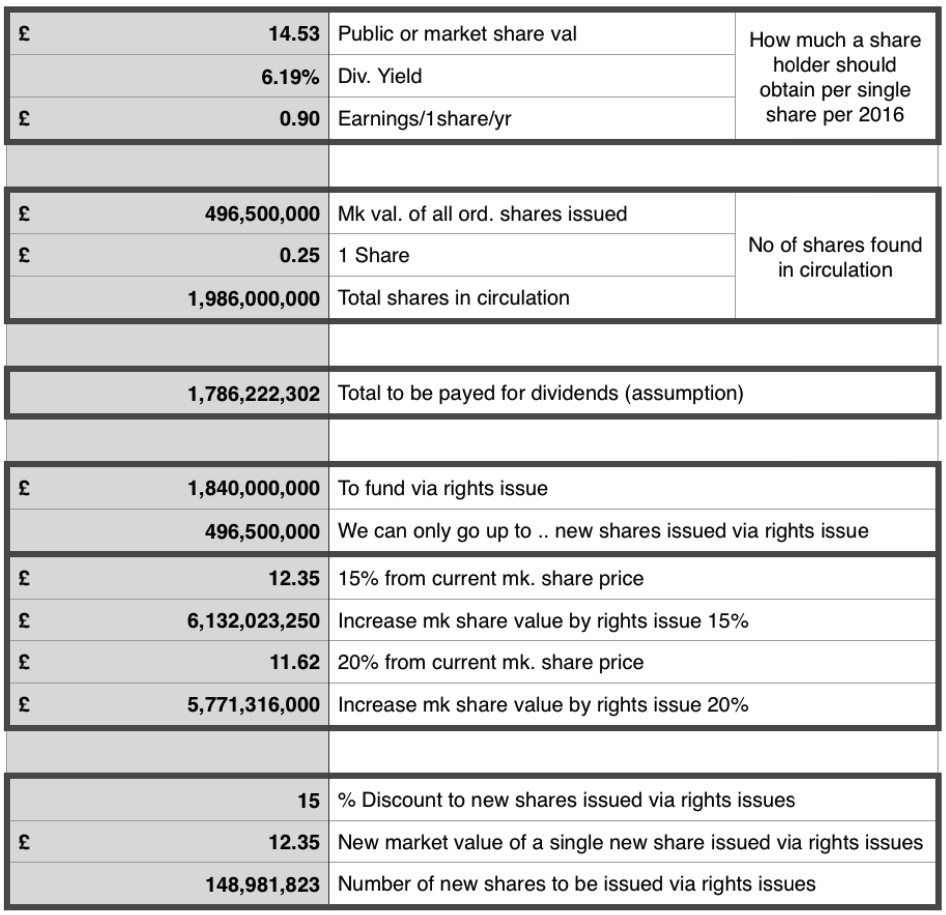
For ease, the number can be rounded to 150,000,000 rights issues, to be made available primarily to existing shareholders at £12.35/share. Other support that the Government can provide is fax relief or similar financial benefits, depending on the risk appetite expressed by relevant public authorities.
Conclusions and recommendations
Given the substantial number of risks and assumptions, considering that the project’s lifespan is over 120 years, the report recommends reconsidering the project substantially to reduce its duration to a period where forecasting can be based on reasonable assumptions. Locking the costs required for the project using known currency rates will remove the risks of further currency depreciation and other unforeseeable costs.
The assumption that the wholesale price will increase by 1.5% per annum for 120 years is problematic, especially considering that alternative power-generating technologies are becoming more popular yearly. Reconsidering discounted cash flows with a minor increase, such as 0.5%, will substantially reduce the risk of overestimating the wholesale income.
Allocating provisions for part replacements will also decrease the cost of hardware failure, which could permanently affect the yearly wholesale income. Utilising a different type of agreement other than a contract for the difference will enable the business to seek a different approach as the current model routes all wholesale income higher than the strike price income towards the Government.
References
Alpha Financials (2017). 10:00, Available at: http://www.af-enviro.com/swansea-tidal-lagoon-a-world-first/ (Accessed: 15 March 2017).
Arnold, G. C. & Hatzopoulos, P. D. (2000). The Theory-Practice Gap in Capital Budgeting: Evidence from the United Kingdom. Journal of Business and Finance and Accounting 27 (5) & (6) p. 603–626.
Brealey, R. A., Myers, S. C. & Allen, F. (2006). Corporate finance. 8th edition, New York: McGraw-Hill Irwin
Department for Business, Energy & Industrial Strategy (2016) Renewable sources of energy, Available at: https://www.gov.uk/government/statistics/renewable-sources-of-energy-chapter-6-digest-of-united- kingdom-energy-statistics-dukes (Accessed: 19 March 2017).
EEEF (2015) EEEF Investments, Available at: http://www.eeef.eu/eligible-investments.html (Accessed: 9/Mar/2017).
Encyclopaedia Britannica (2008). ELI: Energy: Support Materials: Tidal Energy, Chicago, IL: Encyclopaedia Britannica.
Financial Times (2012). Market Data: FT Guide to World Currencies. p. 26
Gordon, M. J. (1959). Dividends, Earnings and Stock Prices, The Review of Economics and Statistics. Vol. 41, No. 2, Part 1, p. 99-105.
Other references
Gov.uk (2017) HS2, Available at: https://www.gov.uk/government/organisations/high-speed-two-limited (Accessed: 19 March 2017).
Modigliani, F. & Miller, M. H. (1958). The Cost of Capital, Corporation Finance and the Theory of Investment. The American Economic Review 48 (3) p 261-297
Mullins, D. W., Jr. (1982). Does the capital asset pricing model work? Harvard Business Review. January 1982, pp 105-115
Pike, R. & Neale, B. (2006). Corporate Finance and Investment: Decisions and Strategies. 4th edition, Edinburg: Pearson.
Rappaport, A. (1986). Creating Shareholder Value, The Free Press, New York, NY
Society of Motor Manufacturers and Traders (SMMT) (2017) Registration of plug-in electric vehicles in the UK between January 2011 and December 2016, 2017: SMMT.
Telegraph (2016) Hinkley points up Britain’s nuclear ambitions, Available at: http://www.telegraph.co.uk/business/2016/09/17/hinkley-point-fires-up-britains-nuclear-ambitions/ (Accessed: 1/Mar/2017).
The Guardian (2017) Toshiba unions UK government, Available at: https://www.theguardian.com/business/2017/feb/14/toshiba-unions-uk-government-nucle (Accessed: 8/Mar/2017).
Tidal Lagoon Power (2017) New Power Cost League, Available at: http://www.tidallagoonpower.com/wp-content/uploads/2016/09/New_Power_Cost_League_Table_2016.pdf (Accessed: 10/Mar/2017).
Tidal Lagoon Power (2017) The Economic Case for a Tidal Lagoon Industry in the UK, Available at: http://www.tidallagoonpower.com/wp-content/uploads/2016/08/The-Economic-Case-for-a-Tidal- Lagoon-Industry-in-the-UK_final.pdf (Accessed: 7/Mar/2017).
Wales Online (2017). Another tidal energy device gets done, Available at: http://www.walesonline.co.uk/ business/business-news/another-tidal-energy-device-gets-10311960 (Accessed: 5/Mar/2017).